Program Arcade GamesWith Python And Pygame
Wait, What Else Can We Do?
What else can we do with programming skills? Once you finish this course and look around, you might find yourself doing something other than programming video games. Your programming probably won't be in Python. In fact, you might not realize you've got an opportunity to do programming at all.
In this chapter we'll look at different examples of what you can do with your programming skills. Even if you don't become a full-time programmer, you can save yourself a lot of time and effort by creating some small programs on the side that keep you from doing repetitive tasks.
5.1 Arduino Demonstration
It used to be that combining programming skills with electronics to control robotics was difficult. Creating embedded systems that combine a small cheap computer that can manage servos, valves, motors, and lights required a very different type of programming. Embedded systems often don't even have an operating system like Microsoft Windows. They might not even have a disk drive!
In the last few years programming embedded systems has become so easy that even some grade school kids are doing it. One of the products helping this new movement of do-it-yourselfers is the Arduino. The specifications for the Arduino are free and open, allowing anyone to create their own embedded solutions for very little money.
There are many other companies that sell Arduino kits. If you have a
good Radio Shack in your neighborhood, it may have a selection of Arduino
computers.
Adafruit (one of my favorite companies) sells an excellent starter pack with an
Arduino computer, some lights,
a motor, a servo, and a few other odds and ends can be purchased for various
companies for less than $100.
http://adafruit.com/products/170
This experimenter's package can be used to build the following Arduino example
that controls nine LED lights, one multi-color LED light, and uses a force sensor
to control a servo arm.
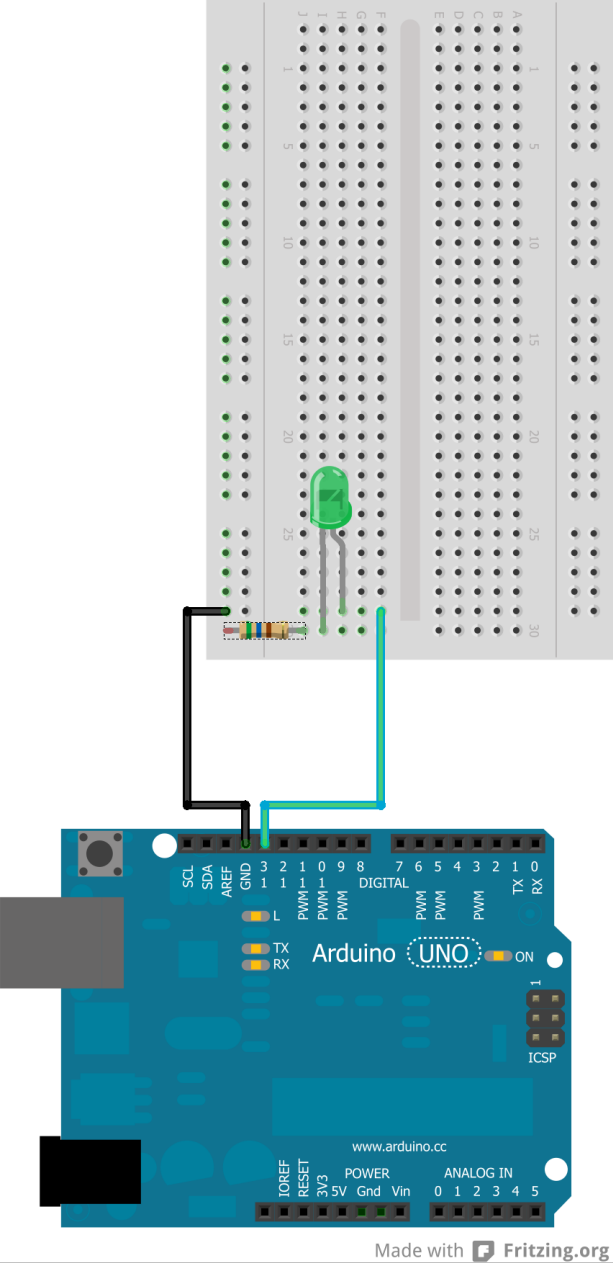
Figure 47.16 shows how to hook up one LED light to the Arduino. The LED hooks up to pin 13 on the Arduino. A “resistor” is also placed in-line to keep the electricity from flowing too fast and burning out the LED. Resistors have different values, and the color codes on the resistor allow a person to select the correct resistor.
This setup for pin 13 is repeated for pins 13 down to 4, so that a total of
9 LEDs can be hooked up to the Arduino.
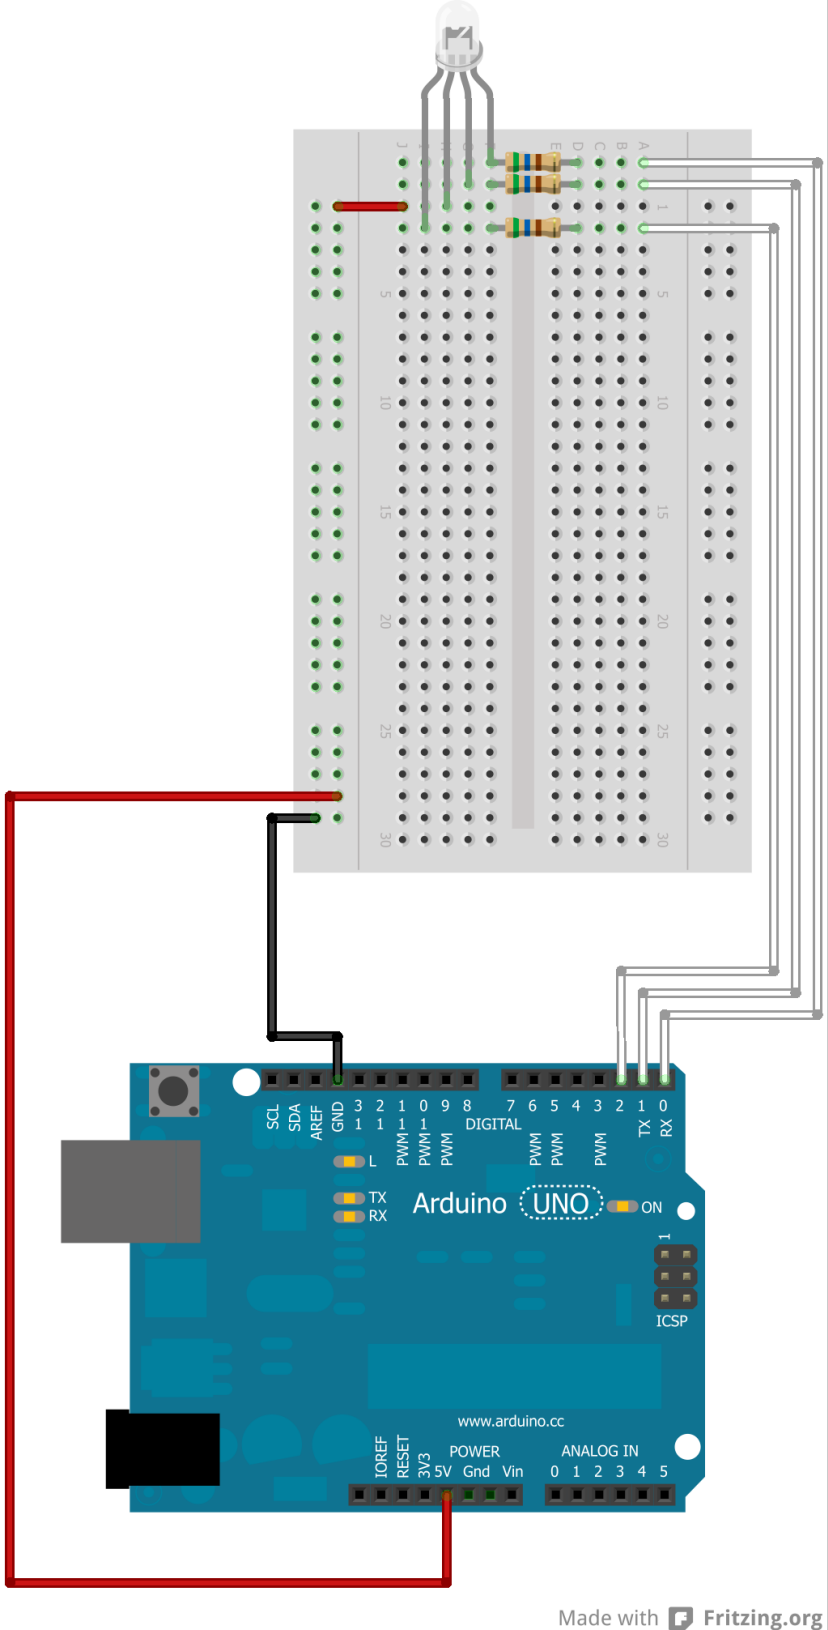
If you don't want to be stuck with only one color of LED, you can use a multi-color LED. Multi-color LEDs have three LEDs built into them. One for red, one blue, and one green. Sound familiar? Colors are specified for the LED by controlling how bright red, green, and blue are. This is just like programming our game!
Hooking up the multi-colored LED is shown in Figure 47.17.

Figure 47.18 shows how to hook up a force sensor to control how far a servo arm moves. The force sensor is very sensitive, and based on how gently it is squeezed, the robotic servo arm can do your work. A little more work and you can create your own exoskeleton!
Take a look at the code below. The code is in the computer language “C.” You'll find the C language has many things that are similar to what we've learned in Python:
- Instead of using import to bring in a library, C uses #include.
- C uses curly braces rather than indentation to determine what goes in a loop, function, or conditional statement.
- In the example setup is a function definition, just as Python has function definitions.
- Rather than what type of data you want in a variable, C requires you to explicitly state that you are creating a new variable, and what data it will store. For example, int r creates a new variable r that holds an integer number.
- The Arduino has a setup function that has code similar to what we'd put before the main program loop in our Python games.
- The Arduino has a loop function that is called over and over. The code in here is the type of code that would go in our main program loop for Python.
- As you can see, there are also random number functions in C.
- The for loop in C looks different than Python, but the concept is the same.
- C also has if statements and uses == to test for equality.
// Import servo library
#include <Servo.h>

// Global Variables
long currentPin=4;
Servo myservo;

// Setup function
void setup() {
    // Attach the servo object to pin 3
    myservo.attach(3);
    // Set pins 1 to 13 for output.
    for( int i=1; i <= 13; i++ )
        pinMode(i, OUTPUT);
}

// Main program loop
void loop()
{
    // Loop from pins 4 to 13
    for( int i=4; i <= 13; i++ ) {
        // Figure out if the LED should be lit
        if( currentPin == i ) {
            digitalWrite(i, HIGH); // On
        } else {
            digitalWrite(i, LOW);  // Off
        }
    }
    // Set the next LED to light up next time
    currentPin += 1;
    // Reset back to the beginning
    if( currentPin > 13 ) {
        currentPin = 4;
    }

    // Get random color values
    int r=random(0,256);
    int g=random(0,256);
    int b=random(0,256);

    // Set red, green, and blue parts of LED
    analogWrite(0, r);
    analogWrite(1, g);
    analogWrite(2, b);

    // Read force sensor on pin A5 (possible range 0-1023)
    int sensorValue = analogRead(A5);
    // Write out servo position (possible range 0-255)
    myservo.write(sensorValue / 4);

    // Delay 150ms before we do this again
    delay(150);
}
5.2 Excel Macro Demonstration
47.2.1 Introduction
Imagine you graduate from college and start work in the business world. A nightmare! You weren't hired as a VP! You are a lowly peon in the business world set to do menial tasks for someone else. This isn't at all like what the college brochure promised you.
You have to create the same charts, over and over for some financial analyst. He makes too much money to be stuck creating charts, so you have your first job creating these charts for him in Excel.
Wait, boring, repetitive tasks! The exact thing that programming was created
to help eliminate! And you took this class in programming, so you should be all set!
Follow the outline below in Excel and create your own macro that will automatically
create charts for stocks. (This is actually what happened to me in my
first job, and was the start to my being able to land my first big project.)
47.2.2 Tutorial
- We are starting our work life as a peon. Here is our job:
- We have to import data from the web.
- We have to chart the data.
- We'll have to create 10 of these charts every day for different data sets.
- Now just about any job could need to do this. That data could be anything. In this case, we'll use stock data.
- Great, our job is boring. Error prone. And takes way too long. Particularly if you want to make the charts look fancy.
- But wait, we took Professor Craven's programming class. Let's try that.
- Too bad we program Excel using Visual Basic, and Dr. Craven taught us Python. Ah well, let's not worry about details like that.
- We'll create an Excel program that creates new stock charts from internet data.
- Outline of what we want our program to do:
- Open a new file
- Import data from web
- Create chart
- Here are the steps to follow so we can program an Excel macro:
- Open the Excel program. I'm using the 2010 version here.
- Type in first cell “This spreadsheet has our program.” This will make it obvious which spreadsheet has our program, and which spreadsheets have the charts.
- Save this file and title it “chart maker” Important: Make sure to save as a Macro workbook! Otherwise your macro won't run. See Figure 47.19.
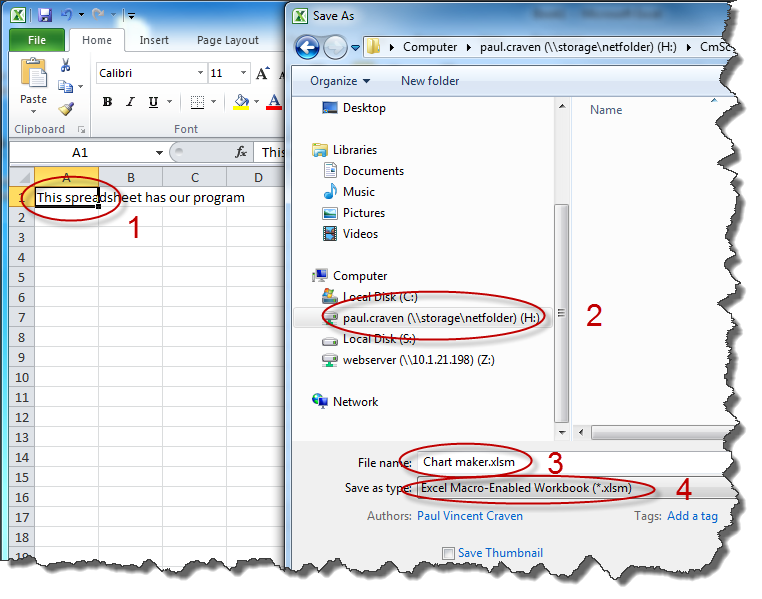
Figure 47.19: Save As - Click “view” tab
- Click the down arrow on macros, then select “record macro.” See Figure 47.20
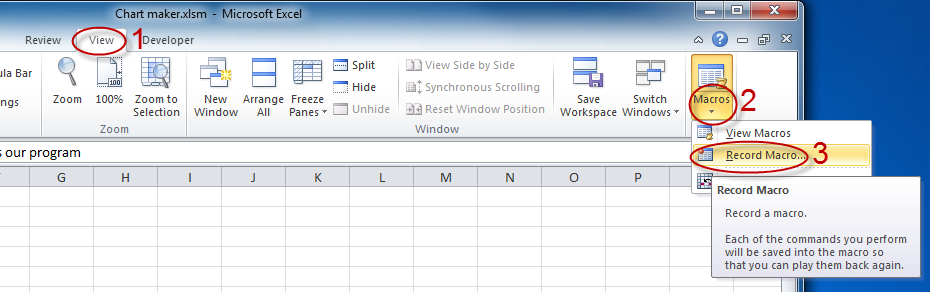
Figure 47.20: Record Maco - Name the macro CreateChart, see Figure 47.21.
- You can't use a space in the name, because this is a function and has teh same rules Python has.
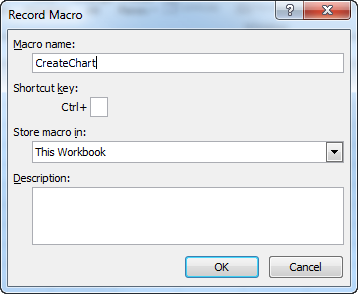
Figure 47.21: Set Macro Name
- You can't use a space in the name, because this is a function and has teh same rules Python has.
- File tab...New...Blank workbook. See Figure 47.22.
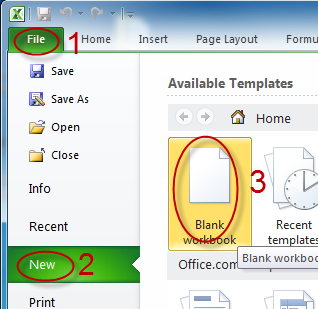
Figure 47.22: Open a Blank Workbook - Data tab...From web (Don't resize the window, it shows a bug in Excel.)
- Use Yahoo to get the stock information:
http://finance.yahoo.com/q/hp?s=wfc - Select the table we are interested in, and import. See Figure 47.23.
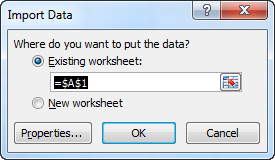
Figure 47.23: Import Data - Select the cells we want to chart. Do this by using the keyboard: ctrl-shift-left, then ctrl-shift-down, then up one.
- Insert tab...Line Chart. See Figure 47.24.
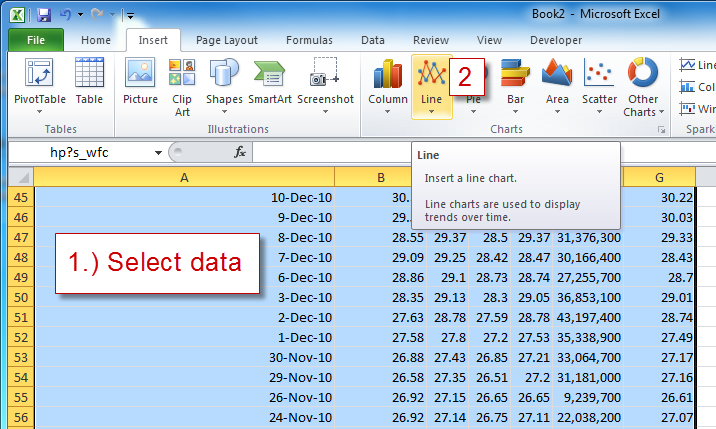
Figure 47.24: Insert Line Chart - Select the option to move to a new worksheet. See Figure 47.25.
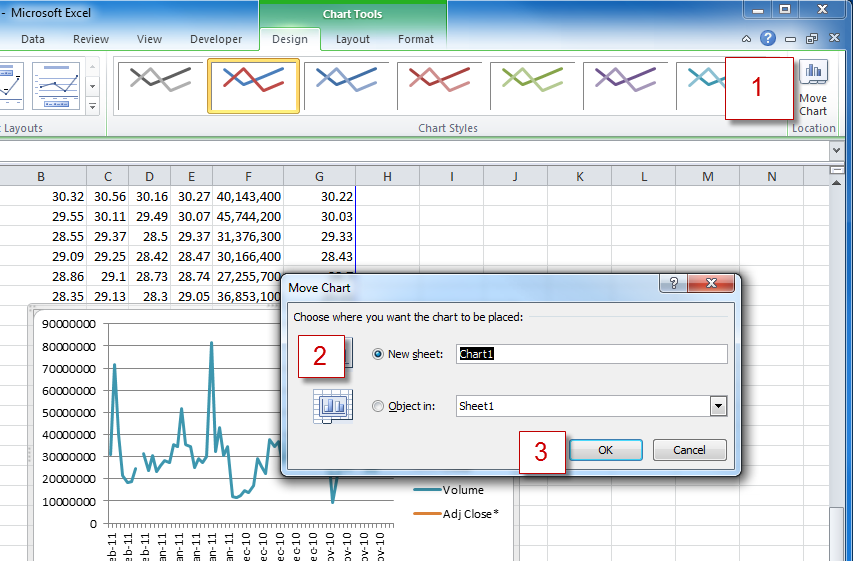
Figure 47.25: Move Chart - Right click on chart, “select data.” See Figure 47.26.
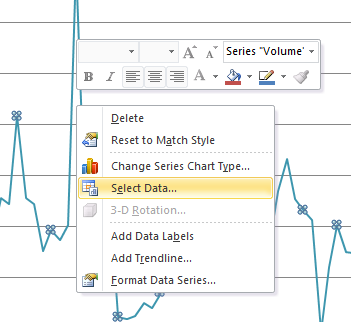
Figure 47.26: Select Data - Modify the data so you only graph adjusted close. See Figure 47.27.
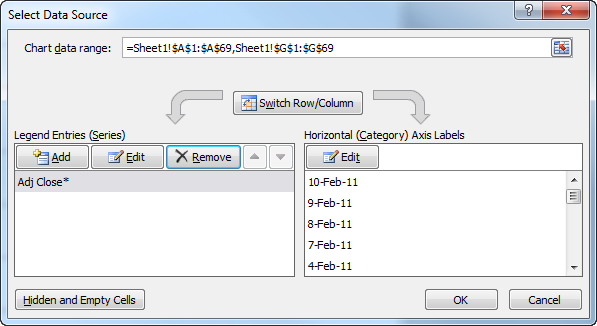
Figure 47.27: Remove All But “Close” - Select “Layout” tab.
- Set the axis labels.
- Remove the legend.
- Change the chart title to something better.
- Stop the recorder (view tab, macros button, stop recording.)
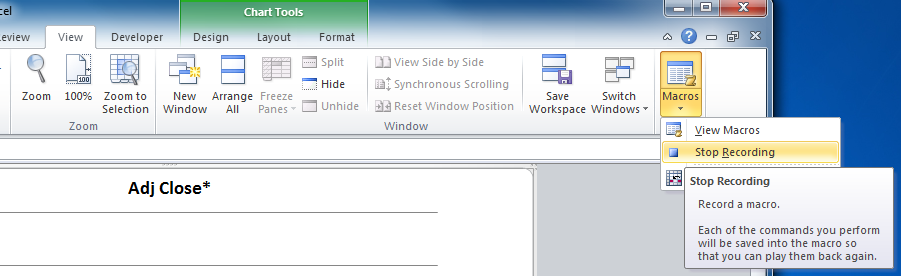
Figure 47.28: Stop Recording - Close the new spreadsheet we created. (Not the “chart maker” spreadsheet with our program.)
- Try it out:
- Run the chart maker macro from the macro menu item.
- Cool! It creates a chart, but what does this have to do with what we studied? Where's the code?
- Glad you asked. Rather than play the macro, click edit.
- Note first line. Sub is short for subroutine. Which is another name for function/method.
- Look, Workbooks.Add, a function to add a workbook! Look at the parameters! Booleans! Objects!
- What happens if we change the Ticker?
- Cool! What if we could have a variable represent the ticker?
- Ok, so what if we could make this into a function where we pass in the URL? See Figure 47.29.
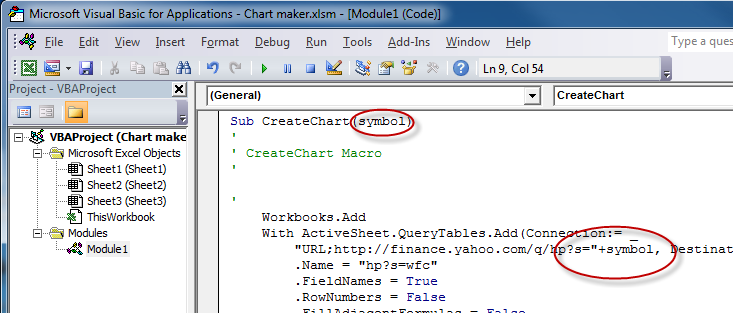
Figure 47.29: Add a New Parameter - And then we can create a new function that calls this with a whole batch of ticker symbols:
Sub CreateCharts()
    CreateChart ("WMT")
    CreateChart ("INTC")
    CreateChart ("WFC")
    CreateChart ("BBY")
    CreateChart ("FDX")
End Sub
This is what your Visual Basic script should look like after recording:
47.2.3 Code Listings
Sub CreateChart()
'
' CreateChart Macro
'

'
    Workbooks.Add
    With ActiveSheet.QueryTables.Add(Connection:= _
        "URL;http://finance.yahoo.com/q/hp?s=wfc", Destination:=Range("$A$1"))
        .Name = "hp?s=wfc"
        .FieldNames = True
        .RowNumbers = False
        .FillAdjacentFormulas = False
        .PreserveFormatting = True
        .RefreshOnFileOpen = False
        .BackgroundQuery = True
        .RefreshStyle = xlInsertDeleteCells
        .SavePassword = False
        .SaveData = True
        .AdjustColumnWidth = True
        .RefreshPeriod = 0
        .WebSelectionType = xlSpecifiedTables
        .WebFormatting = xlWebFormattingNone
        .WebTables = "16"
        .WebPreFormattedTextToColumns = True
        .WebConsecutiveDelimitersAsOne = True
        .WebSingleBlockTextImport = False
        .WebDisableDateRecognition = False
        .WebDisableRedirections = False
        .Refresh BackgroundQuery:=False
    End With
    Range(Selection, Selection.End(xlToRight)).Select
    Range(Selection, Selection.End(xlDown)).Select
    ActiveSheet.Shapes.AddChart.Select
    ActiveChart.ChartType = xlLine
    ActiveChart.SetSourceData Source:=Range("Sheet1!$A$1:$G$69")
    ActiveChart.Location Where:=xlLocationAsNewSheet
    ActiveChart.ChartArea.Select
    ActiveChart.Legend.Select
    Selection.Delete
    ActiveChart.ChartArea.Select
    ActiveChart.SeriesCollection(5).Select
    ActiveChart.SeriesCollection(1).Delete
    ActiveChart.SeriesCollection(1).Delete
    ActiveChart.SeriesCollection(1).Delete
    ActiveChart.SeriesCollection(1).Delete
    ActiveChart.SeriesCollection(1).Delete
    ActiveChart.ChartArea.Select
    ActiveChart.ChartTitle.Select
    ActiveChart.ChartTitle.Text = "WFC"
    Selection.Format.TextFrame2.TextRange.Characters.Text = "WFC"
    With Selection.Format.TextFrame2.TextRange.Characters(1, 3).ParagraphFormat
        .TextDirection = msoTextDirectionLeftToRight
        .Alignment = msoAlignCenter
    End With
    With Selection.Format.TextFrame2.TextRange.Characters(1, 3).Font
        .BaselineOffset = 0
        .Bold = msoTrue
        .NameComplexScript = "+mn-cs"
        .NameFarEast = "+mn-ea"
        .Fill.Visible = msoTrue
        .Fill.ForeColor.RGB = RGB(0, 0, 0)
        .Fill.Transparency = 0
        .Fill.Solid
        .Size = 18
        .Italic = msoFalse
        .Kerning = 12
        .Name = "+mn-lt"
        .UnderlineStyle = msoNoUnderline
        .Strike = msoNoStrike
    End With
End Sub
Once you modify the script to take a parameter so you can graph any stock, it should look like this:
Sub CreateChart(ticker)
'
' CreateChart Macro
'

'
    Workbooks.Add
    With ActiveSheet.QueryTables.Add(Connection:= _
        "URL;http://finance.yahoo.com/q/hp?s=" + ticker, Destination:=Range("$A$1"))
        .Name = "hp?s=wfc"
        .FieldNames = True
        .RowNumbers = False
        .FillAdjacentFormulas = False
        .PreserveFormatting = True
        .RefreshOnFileOpen = False
        .BackgroundQuery = True
        .RefreshStyle = xlInsertDeleteCells
        .SavePassword = False
        .SaveData = True
        .AdjustColumnWidth = True
        .RefreshPeriod = 0
        .WebSelectionType = xlSpecifiedTables
        .WebFormatting = xlWebFormattingNone
        .WebTables = "16"
        .WebPreFormattedTextToColumns = True
        .WebConsecutiveDelimitersAsOne = True
        .WebSingleBlockTextImport = False
        .WebDisableDateRecognition = False
        .WebDisableRedirections = False
        .Refresh BackgroundQuery:=False
    End With
    Range(Selection, Selection.End(xlToRight)).Select
    Range(Selection, Selection.End(xlDown)).Select
    ActiveSheet.Shapes.AddChart.Select
    ActiveChart.ChartType = xlLine
    ActiveChart.SetSourceData Source:=Range("Sheet1!$A$1:$G$69")
    ActiveChart.Location Where:=xlLocationAsNewSheet
    ActiveChart.ChartArea.Select
    ActiveChart.Legend.Select
    Selection.Delete
    ActiveChart.ChartArea.Select
    ActiveChart.SeriesCollection(1).Select
    ActiveChart.SeriesCollection(1).Delete
    ActiveChart.SeriesCollection(1).Delete
    ActiveChart.SeriesCollection(1).Delete
    ActiveChart.SeriesCollection(1).Delete
    ActiveChart.SeriesCollection(1).Delete
    ActiveChart.ChartArea.Select
    ActiveChart.ChartTitle.Select
    ActiveChart.ChartTitle.Text = ticker
    Selection.Format.TextFrame2.TextRange.Characters.Text = ticker
    With Selection.Format.TextFrame2.TextRange.Characters(1, 3).ParagraphFormat
        .TextDirection = msoTextDirectionLeftToRight
        .Alignment = msoAlignCenter
    End With
    With Selection.Format.TextFrame2.TextRange.Characters(1, 3).Font
        .BaselineOffset = 0
        .Bold = msoTrue
        .NameComplexScript = "+mn-cs"
        .NameFarEast = "+mn-ea"
        .Fill.Visible = msoTrue
        .Fill.ForeColor.RGB = RGB(0, 0, 0)
        .Fill.Transparency = 0
        .Fill.Solid
        .Size = 18
        .Italic = msoFalse
        .Kerning = 12
        .Name = "+mn-lt"
        .UnderlineStyle = msoNoUnderline
        .Strike = msoNoStrike
    End With
End Sub
Sub CreateCharts()
    CreateChart ("WMT")
    CreateChart ("INTC")
    CreateChart ("WFC")
    CreateChart ("BBY")
    CreateChart ("FDX")
End Sub
47.2.4 Multiple Choice Quiz
Click here for a multiple-choice quiz.
47.2.5 Short Answer Worksheet
Click here for the chapter worksheet.
47.2.6 Lab
Click here for the chapter lab.
English version by Paul Vincent Craven
Spanish version by Antonio Rodríguez Verdugo
Russian version by Vladimir Slav
Turkish version by Güray Yildirim
Portuguese version by Armando Marques Sobrinho and Tati Carvalho
Dutch version by Frank Waegeman
Hungarian version by Nagy Attila
Finnish version by Jouko Järvenpää
French version by Franco Rossi
Korean version by Kim Zeung-Il
Chinese version by Kai Lin